4 Tips to Optimize Your BI Dashboard for Business Insight
Highlights
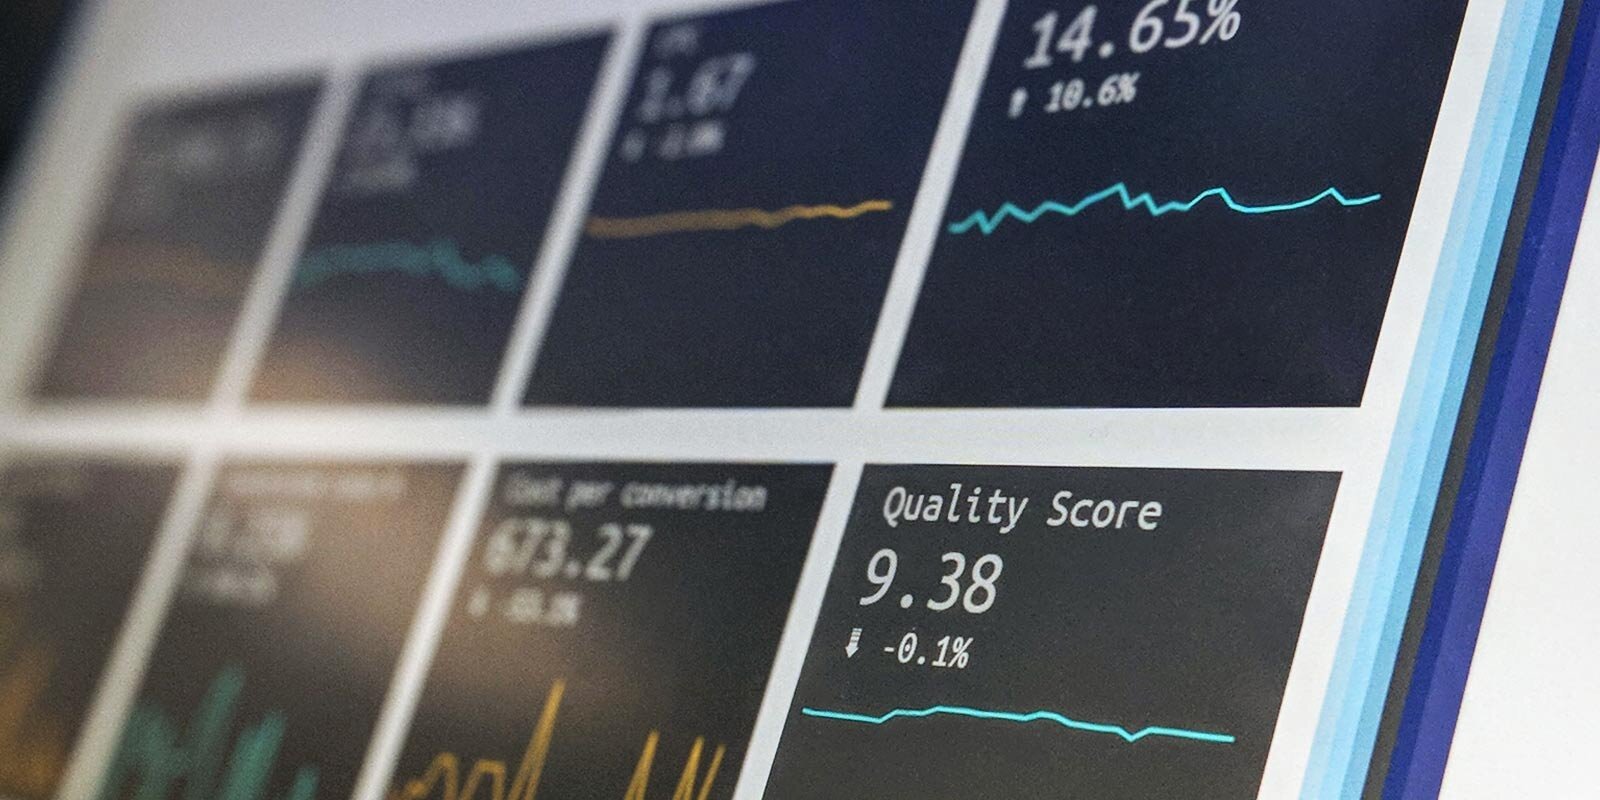
A business intelligence dashboard (BI dashboard) delivers insights at a glance, helping you to streamline decision making and understand your business from multiple angles.
Prime 8 finds BI dashboards so valuable, we make them part of nearly every project.
To get the most out of a dashboard, follow these simple tips: choosing the right data, improving the user experience, automating reports, and improving the visual design.
Modern businesses must understand the information they have on hand to thrive in their markets — and an optimized BI dashboard is one path to understanding and acting on this information. Here at Prime 8, we incorporate BI dashboards into nearly every project we do. We believe that companies should create a Single Source of Truth (SST) that nests all core business intelligence to facilitate data-driven decision making.
However, this task is often easier said than done. “Laggard” companies still base over 70% of their decisions on “gut feelings,” whereas larger companies only use 40% of available information on average.
To maximize how you use information, an optimized Business Intelligence (BI) dashboard is essential. Here at Prime 8, we incorporate BI dashboards into nearly every project we do. A well-designed BI dashboard not only simplifies access to the data that drives performance, it helps create the Single Source of Truth (SST) that nests all core business intelligence to facilitate data-driven decision making.
Research by Forrester and others backs this up: Compared to organizations that are just getting started, companies that have already made a significant commitment to using tools such as BI dashboards are eight times more likely to say they grew by 20% or more.
So, how can you optimize a BI dashboard to acquire a more accurate, updated, and comprehensive understanding of your business from all angles?
Here are four quick dashboard best practices that will provide better business insights.
1. CHOOSE THE RIGHT DATA
You may already have a BI dashboard, but are you using it to track the right information? Or maybe you’re about to build your first BI dashboard and are struggling to understand what to include, so your organization can make better business decisions based on data collected.
Start by asking your team the right questions. To ensure the data you have is in line with your goals and requirements, ask each department:
What key performance indicators (KPIs) do they use to measure success and make decisions?
Are these KPIs currently included in existing dashboards?
What’s clear about the dashboards or reports they’re currently using? What’s unclear?
Do you have access to all the internal and external data that you need?
Gather this information from your team and use it to update or plan your BI dashboard optimization. Most of the data above already exists in your company. For example, your CRM system should contain account values, email interactions, and account behaviors — but you may need to set up an automation that pulls it into your dashboard.
In the end, it’s all about asking the right members in your organization for the data you need and plugging this data into the dashboard. Therefore, the first quick fix to gather better insight is to simply fill in the blanks with the data you already have.
2. TALK ABOUT USER EXPERIENCE WITH YOUR TEAM
Your users, the people in your organization who will be interacting with the dashboard on a day-to-day basis, often know what they want, even if they don’t know how to make it happen.
Asking for direct feedback is the fastest way to improve an existing dashboard. You can start by asking the following questions:
Can your team customize your dashboards according to their needs? Is it possible to build a dashboard with the KPIs each department focuses on within a few clicks and drops?
Is it possible for team leaders to share their dashboards with other members by changing access permissions, with a “view only” link, or by inviting other members?
Can multiple departments interact with the BI dashboards they need to collaborate? Can they compare data without leaving the system?
Is it possible to directly comment on the data to keep all communications in one place?
These improvements cost you little time but can have a large payoff in the day-to-day work of employees across your organization.
Once you have the answers to these questions, you can start making targeted improvements. You can give team leaders administrator-level authorizations to change their dashboard permissions or connect your existing internal chat channel to the dashboard.
These improvements cost you little time but can have a large payoff in the day-to-day work of employees across your organization.
3. CREATE AUTOMATED BI REPORTS
Companies are more interested in automating business processes than ever before. Research shows that 66% of businesses explored automation in at least one business process in 2020, compared to 57% two years prior. But only about 31% of companies had fully automated a process, showing there’s still plenty of room for improvement.
If your company is still relying on spreadsheets, you’re falling behind. One low-lift area to explore is the development of automated BI reports and analytics.
Does your team look at the same dataset regularly? Is there a list of KPIs you track weekly, bi-weekly or monthly? Allow your team to invest their time on more intricate tasks by automatically generating essential reports.
For example, consider building an automation for:
Monthly and quarterly P&L
Employee attendance and absence
Website and social media traffic
General sales performance reports
Automated reports will provide essential information with no additional manual labor required. This allows your team members to focus on generating higher-tier reports that will bring you more accurate and in-depth business insights.
4. GET SMART WITH BI DASHBOARD DESIGN
You may be using a dashboard to deliver all the right information, but if that information is not effectively presented, the impact and value is diminished. Using effective data visualization techniques in your dashboard makes it easier for people to draw business insights faster and more accurately. Below are some quick fixes you can implement immediately for a more impactful visual experience.
ADD WHITE SPACE
Studies show that human eyes need blank space to segment and consume information properly. While it’s tempting to utilize as much space as you possibly can in one view, clutter will confuse your users and result in misinterpretations and mistakes.
SWITCH TO A STANDARD FONT
While everyone has their own font preferences, pick a widely accepted web font to make data more readable and accessible to members of your organization. A standard font also reduces errors during data analysis.
USE COMPLEMENTARY COLORS
Complementary colors make it easier to distinguish different data sets and make comparisons. Online color wheels will generate complementary color sets you can use if you’re unsure where to start.
GETTING THE MOST OUT OF YOUR BI DASHBOARDS
A BI dashboard serving as the single source of truth empowers your team to take control and use data to make real differences in your business. While anyone can put together a meaningful dashboard using a tool like Power BI, it can help to get an expert’s insight into what works best for a business like yours.
At Prime 8 Consulting, we strive to help our clients get the most out of data. We’ll help you implement robust tools that target and use the right data, taking the guesswork out of the equation. Reach out to learn more about how we can help improve your business intelligence.


